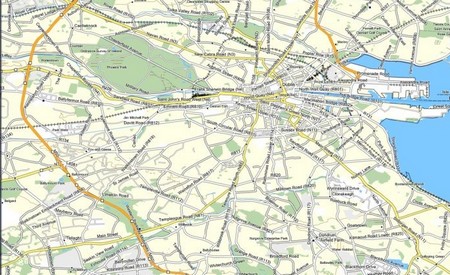
There are two sorts of maps: plan metric and topographic. The first are simple, flat plans such as street maps and of no use to hill walkers. Topographic maps show the shape of the land. They do this with contour lines, which join points of the same height. The closer contour lines are together the steeper the slope. Contour lines reveal the shape of hills so you can gain a good idea of what to expect. They tell you where ridges, cirques and plateaus are and whether summits are small and pointed or flat and spacious.

A common problem with reading contours is distinguishing between spurs and valleys. The quickest way to do this is to look for a stream as if one runs down the middle of the contours it is clearly a valley. The absence of a stream does not mean it is a spur though, as not all valleys have streams in them. However, contour lines are always marked with the elevation above sea level at certain intervals. Ordnance Survey maps are marked every 50m – more often in places on Outdoor Leisure maps – and Harveys every 75m. Some of these heights are printed the right way up on the map, some upside down or sideways. This is because they always read upwards so if they are the right way up then the ground slopes up towards the top of the map, if they are upside down the low ground is towards the top. These contours are also drawn with a thicker line. By following them until you find the heights you can work out whether a feature is a ridge or a valley.
Contours are also drawn at regular intervals, every 10m on Ordnance Survey maps or every 15m on Harleys. Knowing the interval is important as features shorter than the interval, such as sheer drops, may not be marked – 8m is still a long way to fall. Where maps of different scales have the same contour interval the contour lines will be closer together on the smaller scale map so a slope will look steeper than on a larger scale map. Becoming familiar with the contours on different maps is important for accurate reading of the terrain.